
COVID-19 Mortality Update - July 2022
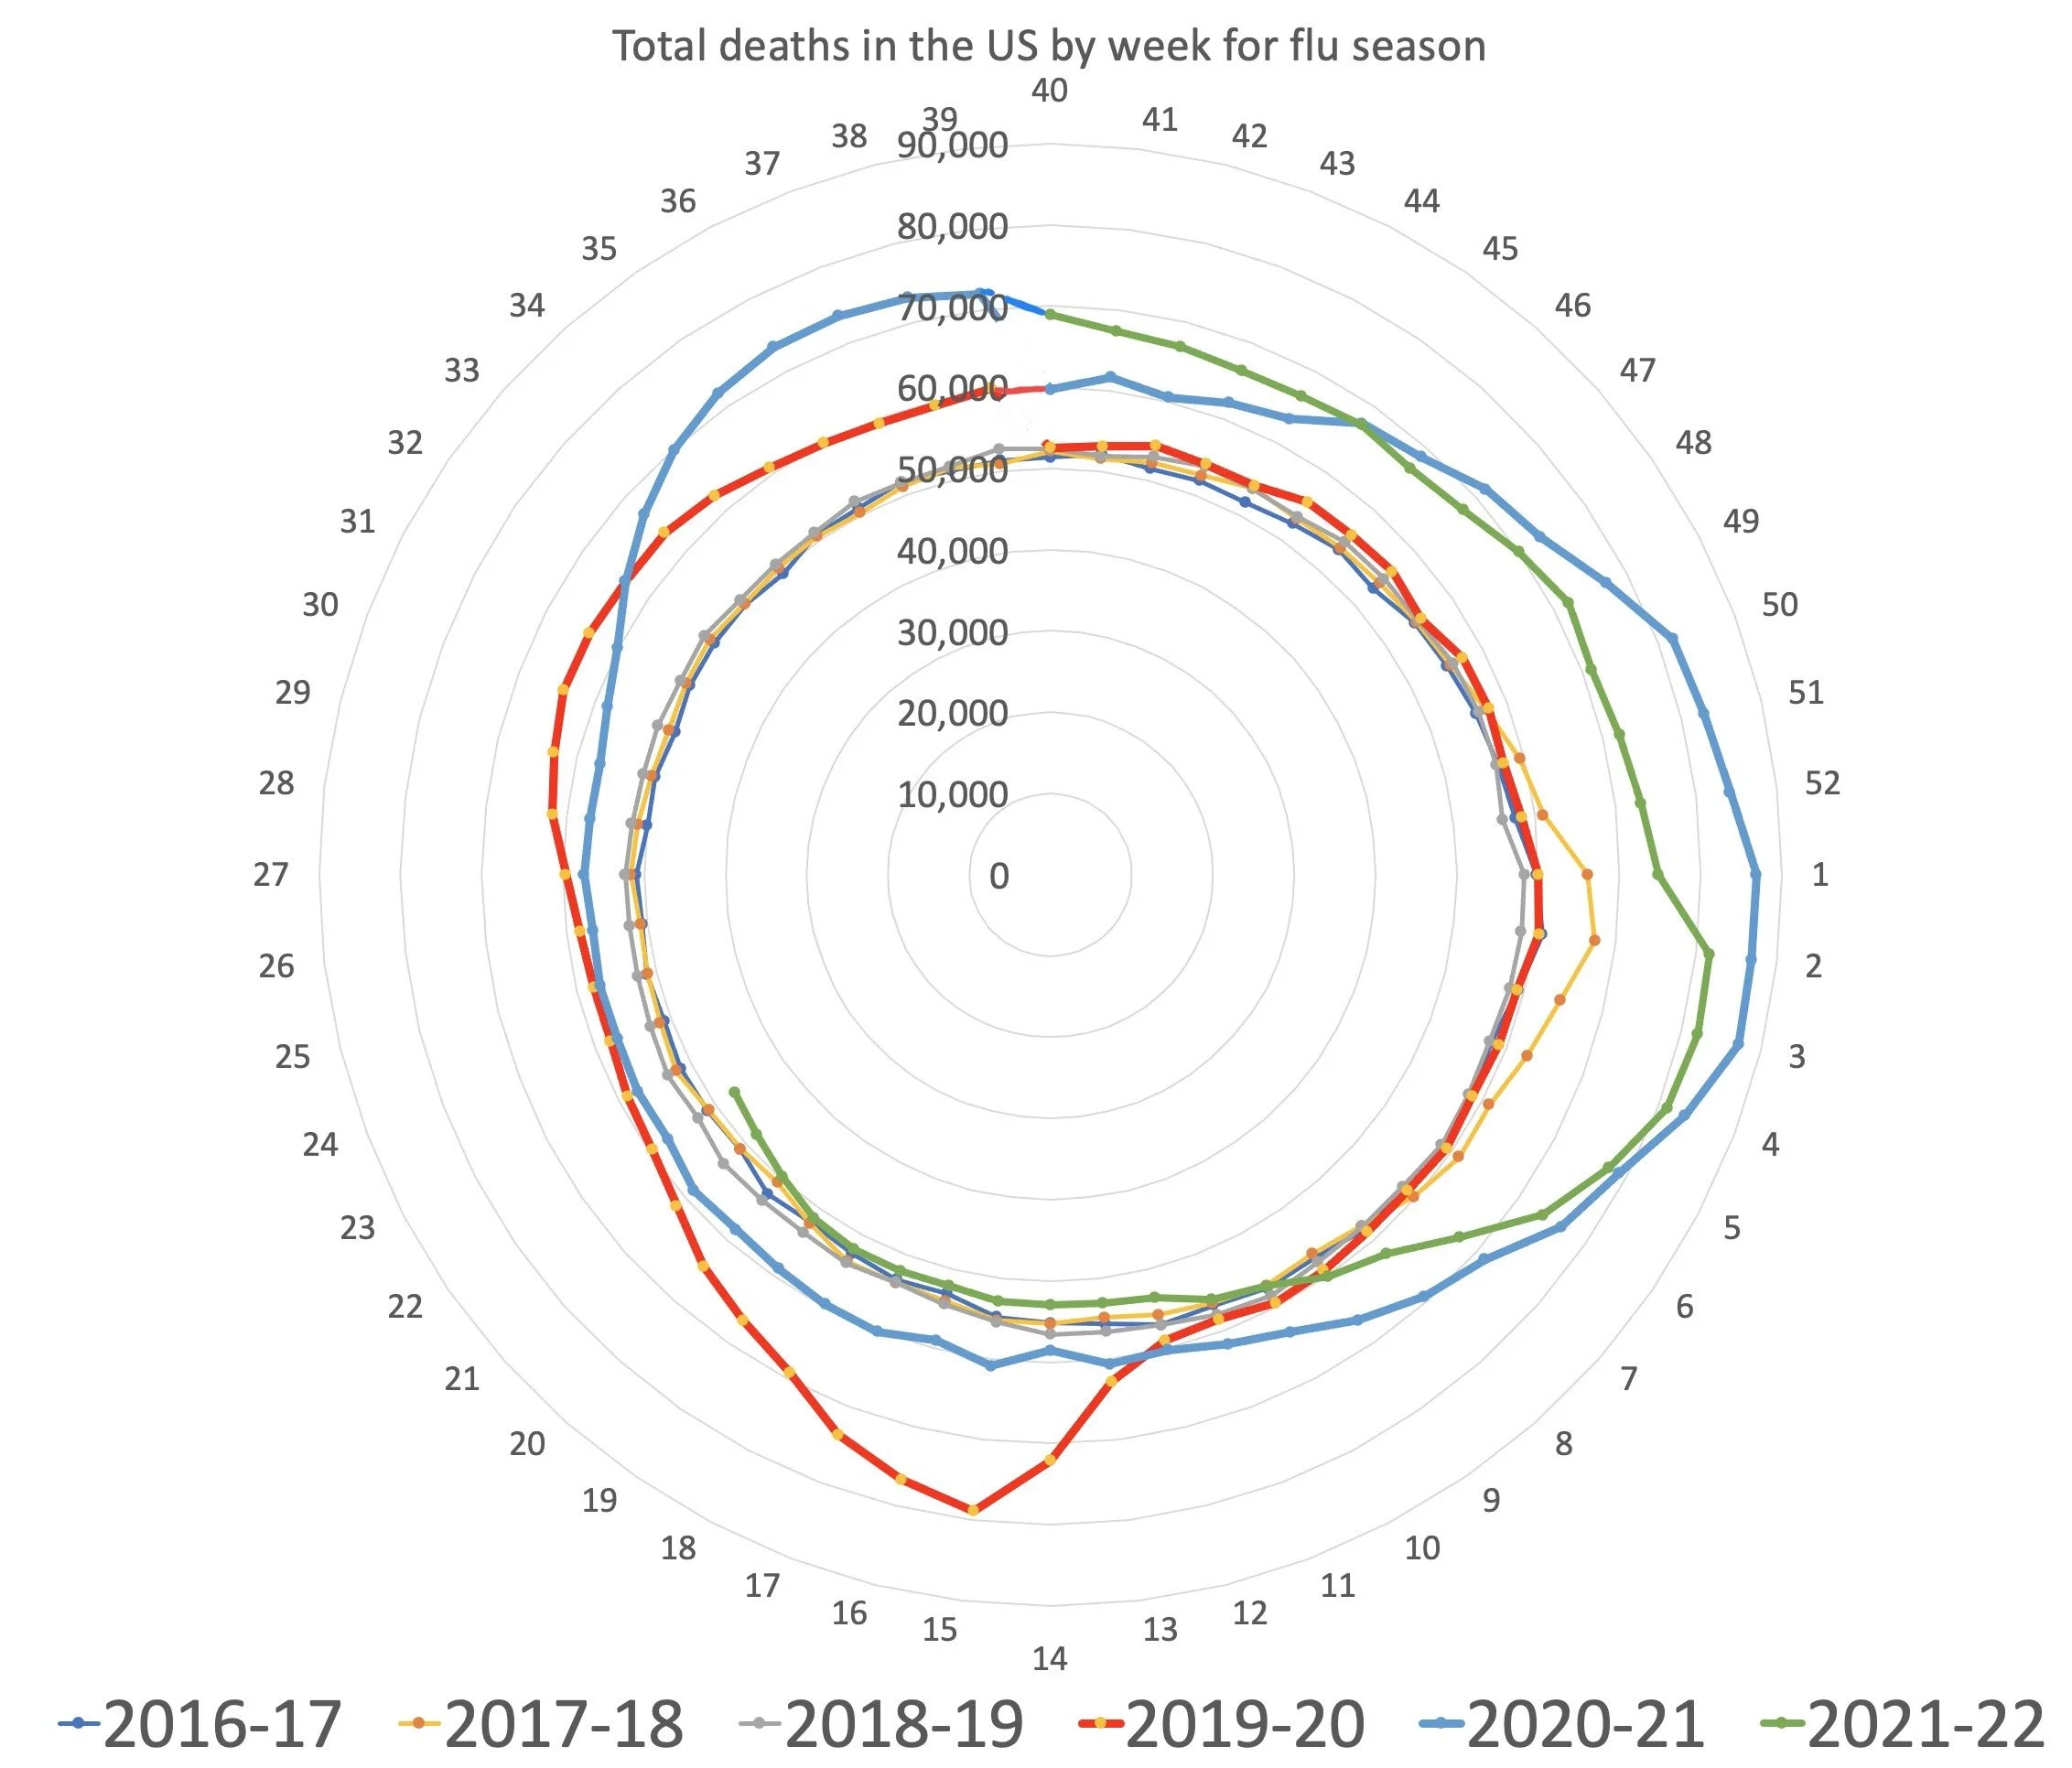
This chart compares the total number of people who have died in the United States from ANY cause for this and the previous four years using data from the CDC. The X-axis (radius) is the week of the year. (Week 1 ends January 2-8 depending upon the year; Week 13 is the first week in April, and Week 39 ends on or about September 30th of each year). There is no doctoring these numbers as it is all deaths for ALL causes.
My Thoughts
While not all the additional deaths can be attributed to C-19 and indeed some can be linked to the lockdowns (increased suicides, reduction in preventative care, etc.) anyone who thinks C-19 was “just like the flu” is an idiot.
Following the green line for 2021-22, it seems we are not only back to “normal",” but even below normal. This makes sense as many of the people killed by C-19 were older and would possibly have passed away due to other causes by now. I suspect this trend will continue barring another more deadly strain of C-19.
This chart runs through Week 22 (ended June 4), it is likely more deaths will be reported for that period, so the very tail of the green line will come up closer to the other years.